SUPERMON PERFORMANCE
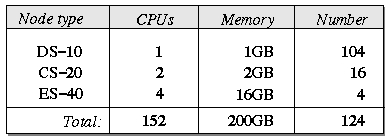
The majority of development time on Supermon was dedicated to making each portion of the system as efficient as possible. Efficiency at each level allows Supermon to achieve the high sampling-rate goal that was unattainable with older monitoring tools. The main metric for measuring Supermon's capabilities is the number of samples per second that can be taken from a node or cluster. We are most interested in the lower bound for sampling rates when samples contain the maximum amount of data. All of our benchmarks were performed using the complete data set offered by mon from each node. (Note: That data set is larger than what rstatd provides). The system we used for benchmarking was the LANL ACL xed cluster, which is composed of three types of Compaq Alpha-based compute nodes. There are a total of 124 nodes, containing 152 processors with a total of 200GB of memory. The specifications of the nodes are given in Figure 2.
Figure 2:
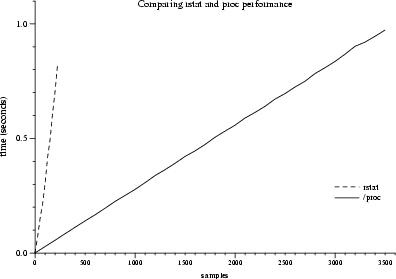
The first test measures a program's maximum sampling rate reading directly from /proc entries provided by the Supermon kernel module. It compares the performance of that Supermon capability to the method used by RPC-based rstatd to gather its data. The lowest sampling rates we found from /proc were 3,400Hz on the DS-10 and CS-20 nodes, while the ES-40 nodes achieved 6,000Hz. The test was also run on an Intel Pentium III machine, with performance comparable to the ES-40.
Comparing those results to rstat's get_stats()
call,
we found a huge performance improvement (see Figure 3). Using the same
benchmark program used for measuring /proc - with a minor change to
call get_stats() instead of reading a file -
we observe a
peak performance of 300Hz. Not only is that an order of magnitude
slower than /proc, we will shortly see that that is slower than the
sampling rates observed after the data has passed through a single mon
process and a single Supermon process.
Figure 3:
To measure the performance of mon and Supermon, we used a program similar to the one for measuring /proc. Instead of opening a file handle and reading, the benchmark program opened a socket to the data server, sent a command asking for all data provided by the server, and read that data before sending another request. With mon, the data must pass over two channels: It is first read from the /proc entry, and then sent between mon and the client over TCP.
For Supermon, using the same benchmark as for mon (which was possible, since mon and Supermon use an identical protocol), we measured the maximum sampling rate for various configurations of Supermon. The first case had Supermon gather data from a single mon process (see Figure 8). The second case measured multiple nodes: it tested with 5, 10, 20, and 100 nodes monitored by a single Supermon process. The final test gauged Supermon's performance in a hierarchical topology. There were two cases: First, each Supermon had a fanout of 10 nodes; in the second case, each Supermon monitored 50 nodes. At the hierarchy's root a single Supermon process gathered the entire cluster data set from the Supermons observing subsets of nodes.
To make the test environment closer to actual practice, we took care to lay the Supermon servers out such that each ran on the first compute node in each node subset. For example, if there were 100 nodes in groups of 10, a Supermon server would ran on nodes 0, 10, 20, etc. The Supermon server responsible for data gathering from each node subset ran on a computer outside of the subset. Finally, the client ran on the cluster front end. Two reasons warranted that separation of Supermons: First, we wanted to avoid overwhelming a single machine with many Supermon servers exchanging data. Second, we wanted to avoid any effects caused by loopback devices or TCP optimizations for socket communication within a single computer that could generate results showing higher sampling rates, but without accounting for the network's effect on the monitoring process.
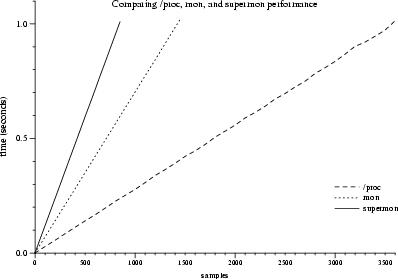
Figure 4.
Number of
samples over time, comparing sampling rates from /proc, mon,
and Supermon. Decrease in maximum sampling rate is due to the network.
Figure 4 shows the performance
results when testing Supermon's
scalability. The number of nodes corresponds to the number of mon
servers a single Supermon connects to. When all 100 DS-10 nodes were
monitored, we performed three different tests to show the effect of
hierarchical Supermon servers on performance. The basic case followed a
flat topology: A single Supermon connected to all 100 nodes. Next, each
Supermon connected to 10 clients (a single Supermon connected to 10
other Supermons, each of which then connected to 10 mons). Finally, a
single Supermon connected to two Supermons responsible for monitoring
half of the cluster each (50 mons). We were surprised to find that,
contrary to popular belief, hierarchy is not guaranteed to increase
performance. In our case we showed that the additional network traffic
between the layers of Supermon servers had a negative impact on the
sampling rates.
Figure 5:
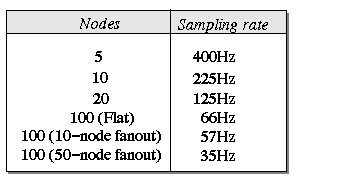
Figure 5. Scaling results for Supermon.